Scientific Plots
2022-10-08 16:24:27
# Python
In the postgraduate course (科学数据处理与分析) starting from the autumn semester of 2022, I was in charge of Chapter 2. The task of Ch2 is shown below:
- Please read the instruction material, choose one to complete
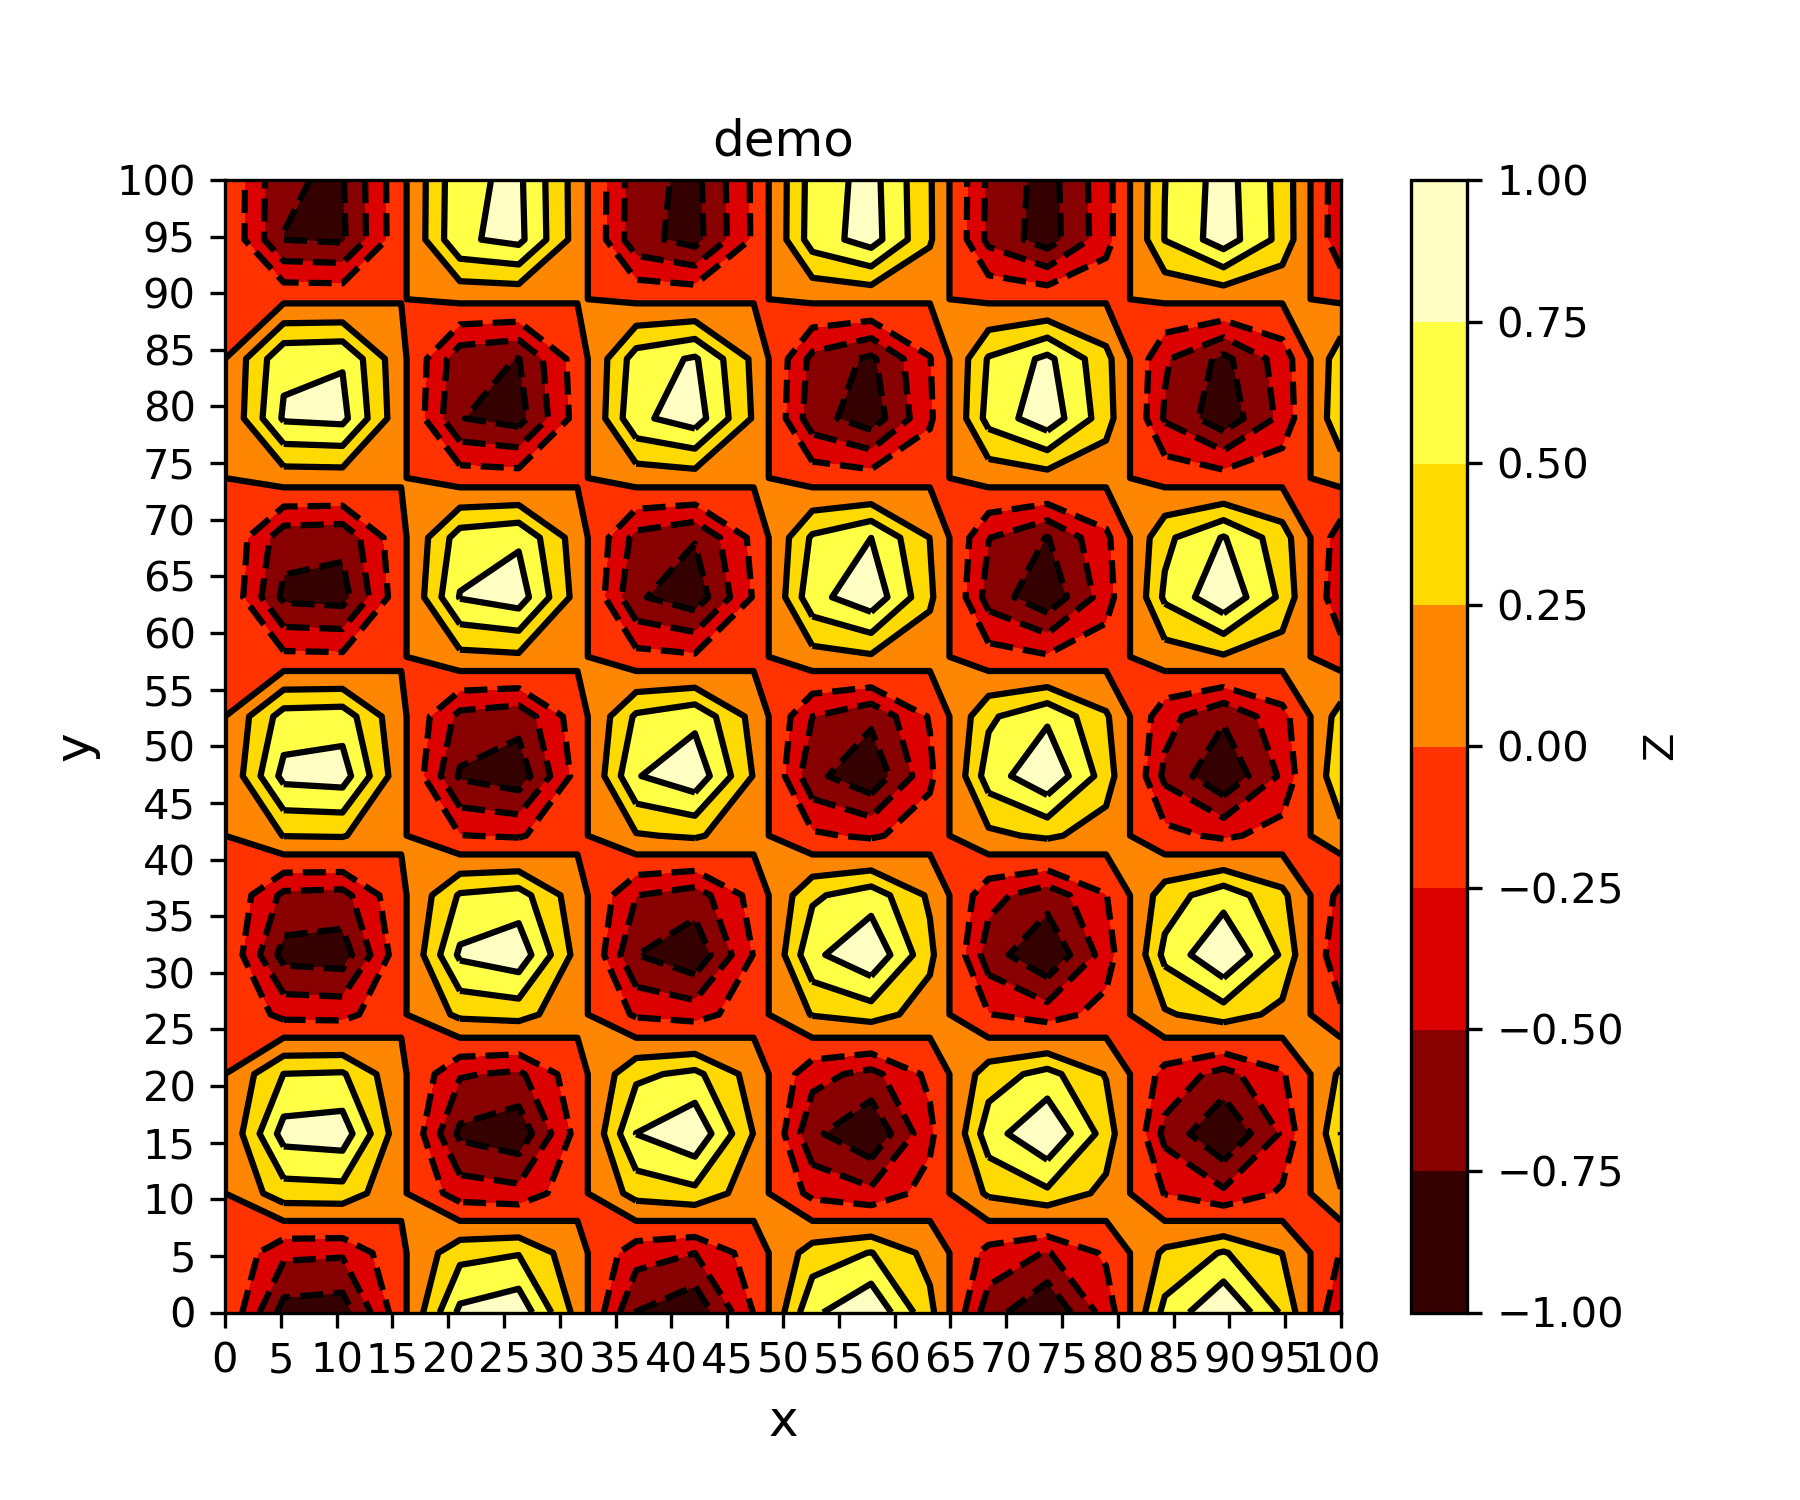
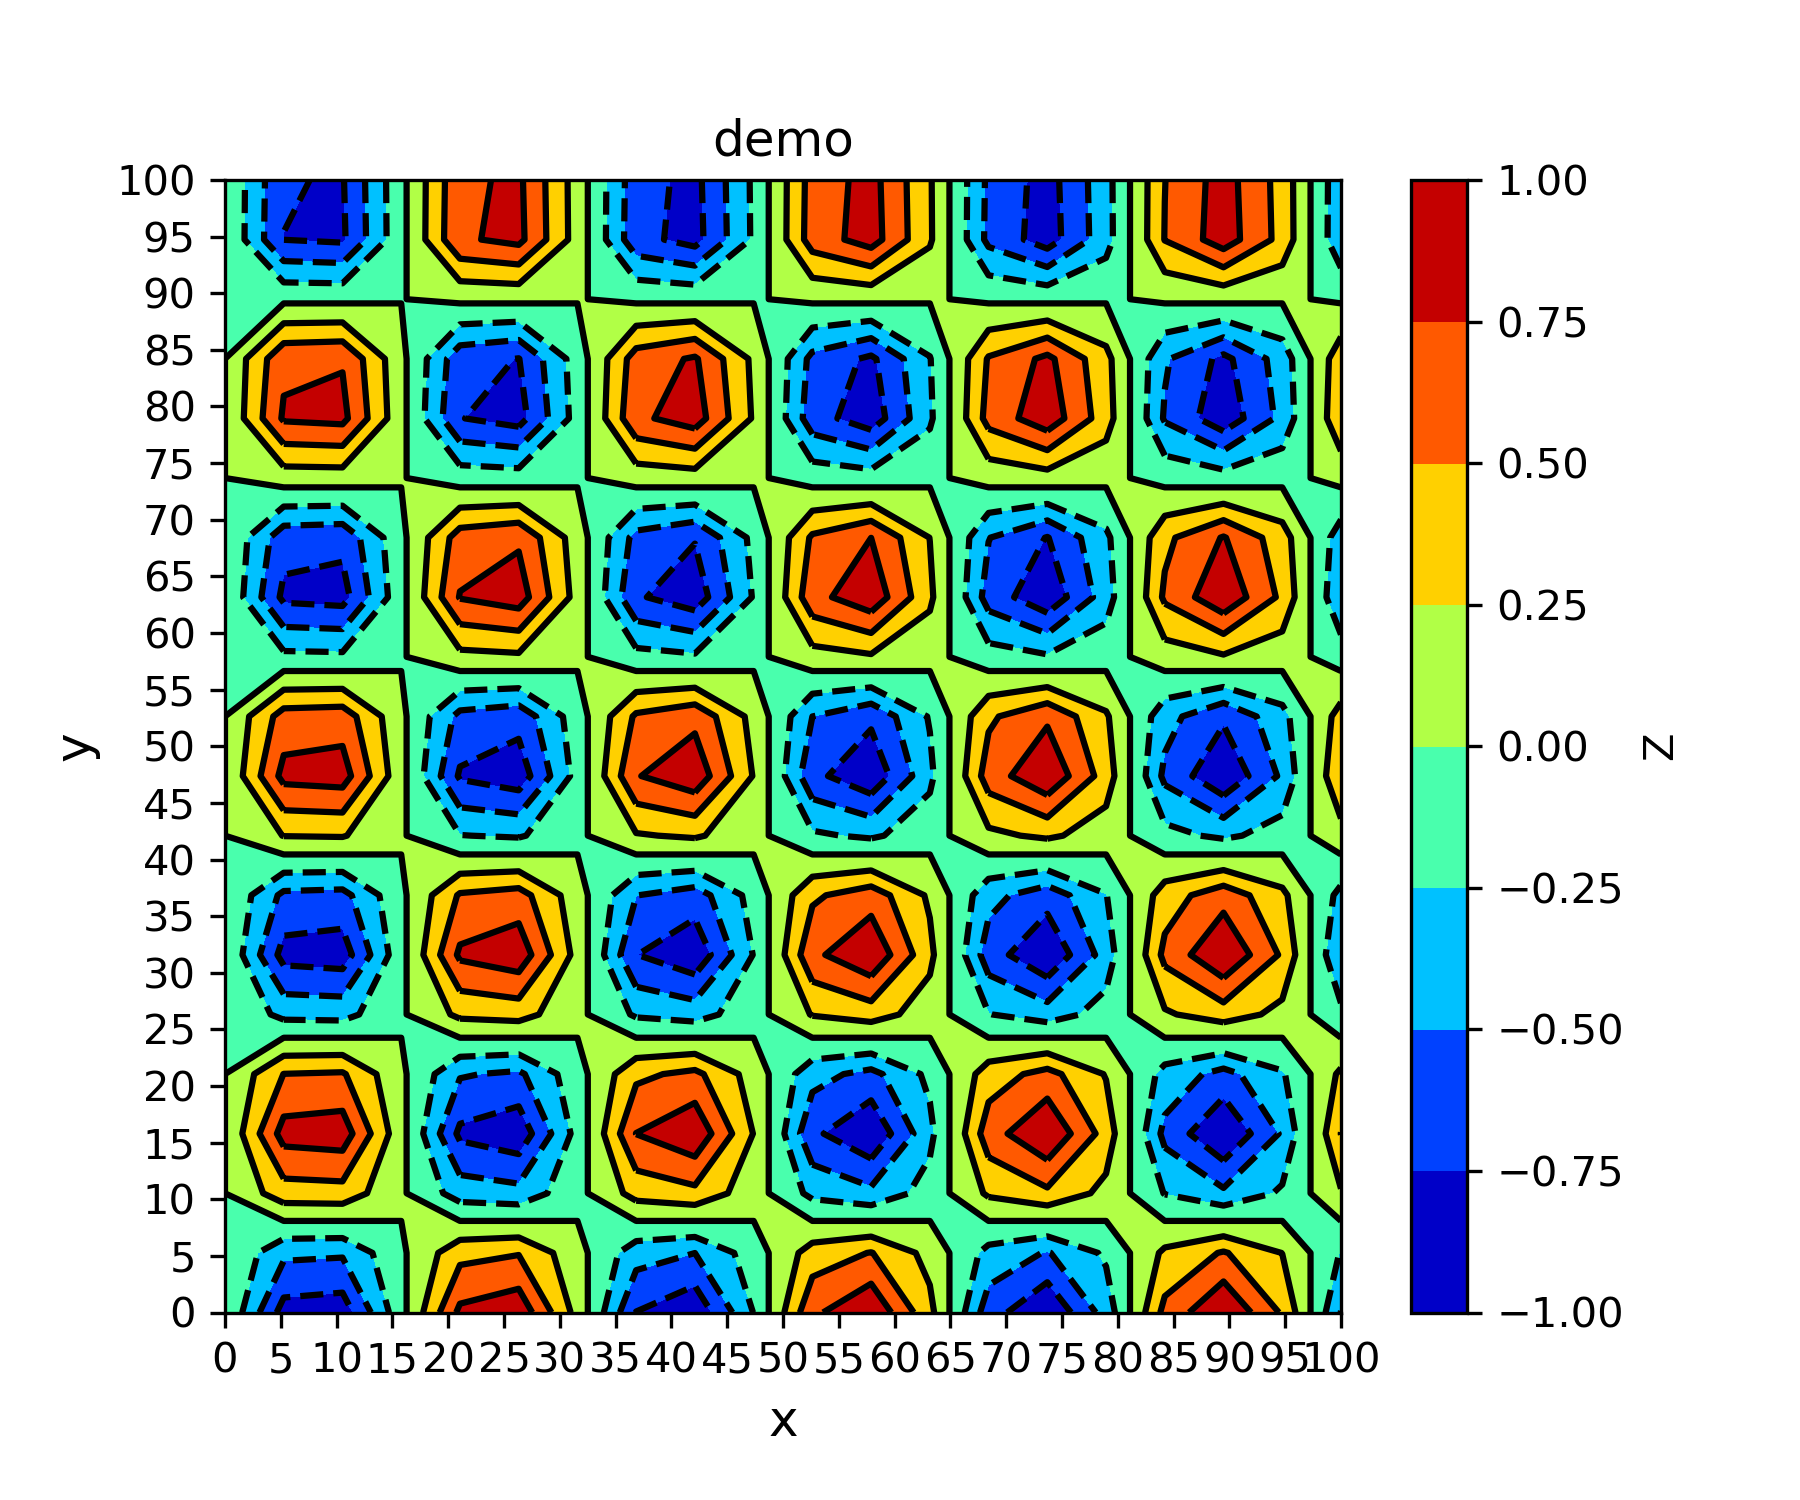
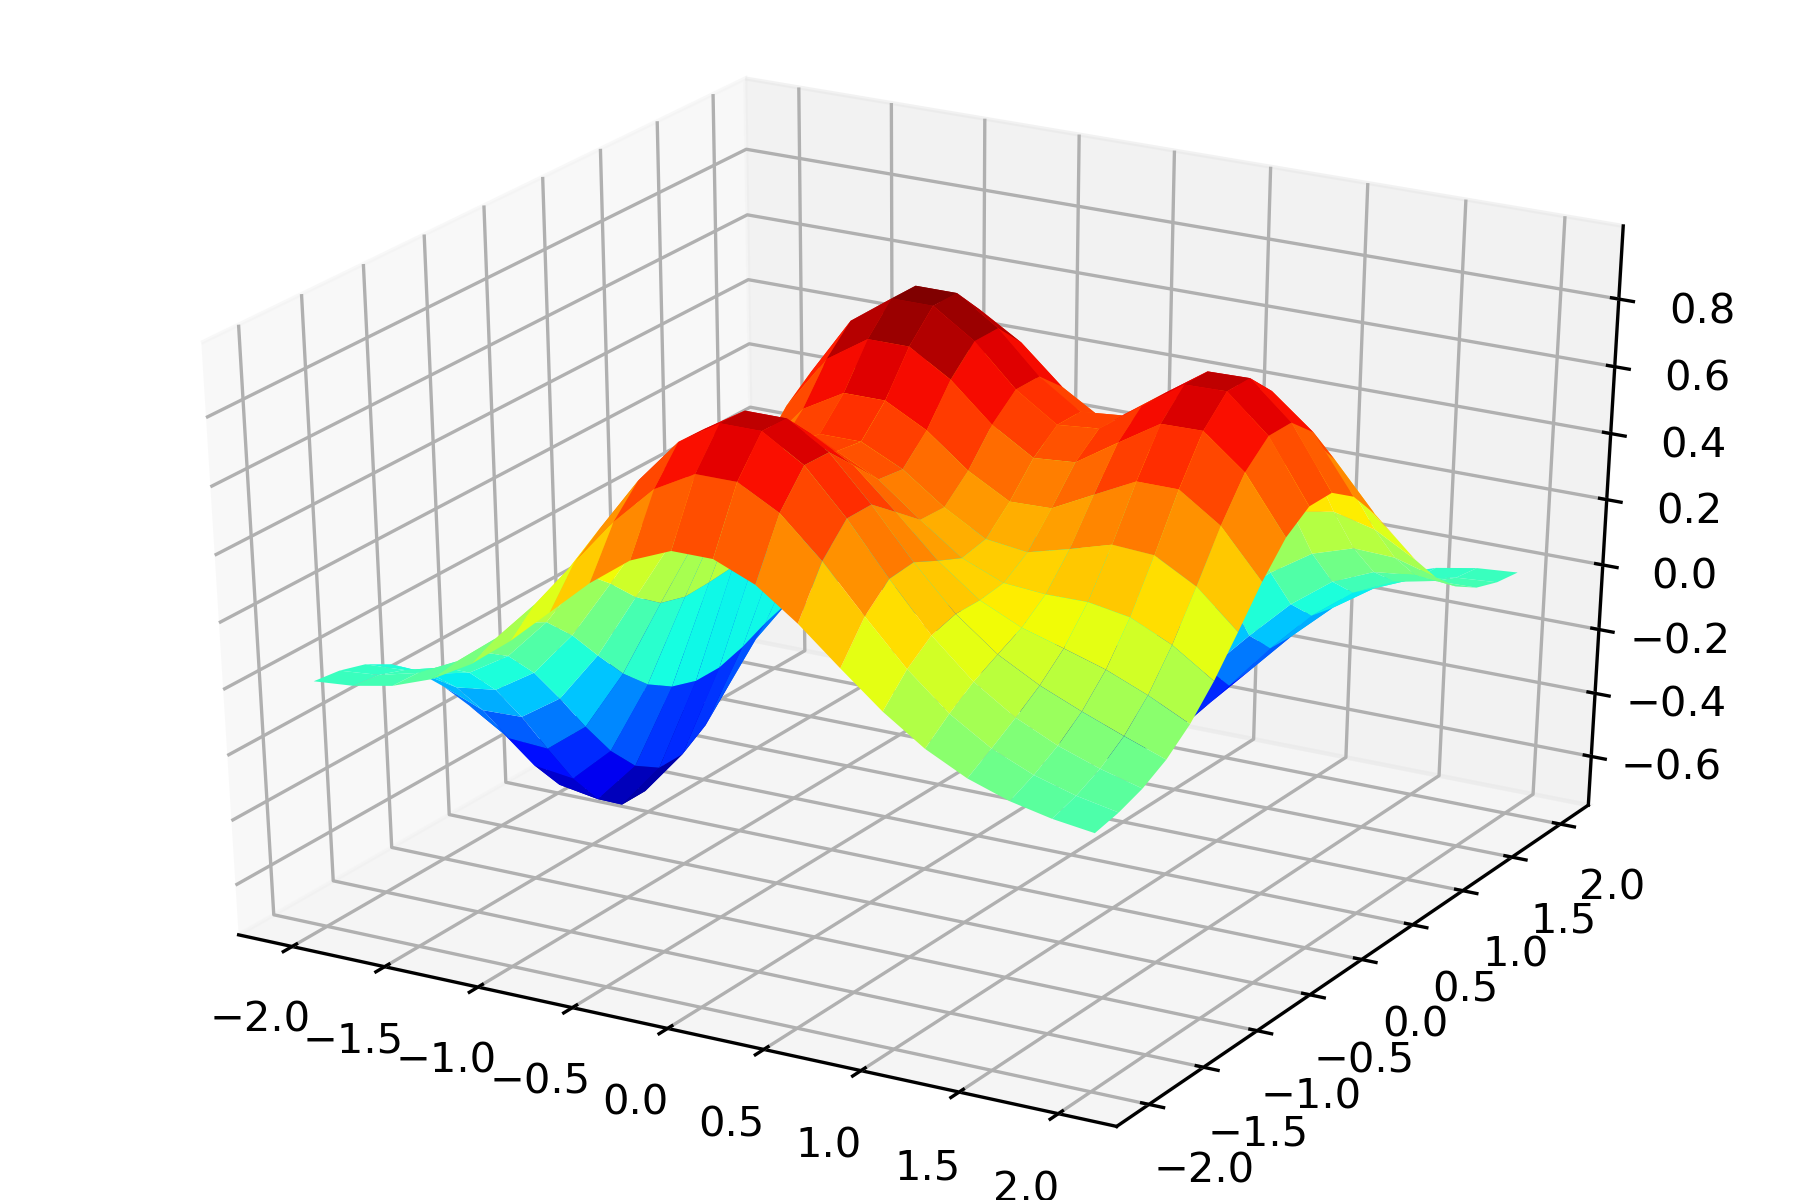
Below are some examples plotted using matplotlib:


